
- Joined
- Jul 24, 2008
- Messages
- 33,627
- Points
- 0
<TABLE border=0 cellSpacing=0 cellPadding=0 width="100%"><TBODY><TR><TD class=wintiny noWrap align=right>31318.76 in reply to 31318.75 </TD></TR><TR><TD height=8></TD></TR><TR><TD class=msgtxt>http://singaporemind.blogspot.com/
Thursday, April 08, 2010
<!-- Begin .post -->Mah Bow Tan : We don't fudge the numbers Part 2
Here's the chart from the Straits Times to show that HDB price move in tandem with household income:

Hazel Poa[Link] showed that when the base year is changed to another year besides 1999 the household income falls behind the rise in property prices. But there is something more sinister that can be shown in these charts.
You wonder what the same chart looks like if we go back another 10 years to plot for a 20 year period with 1990 as the base year:
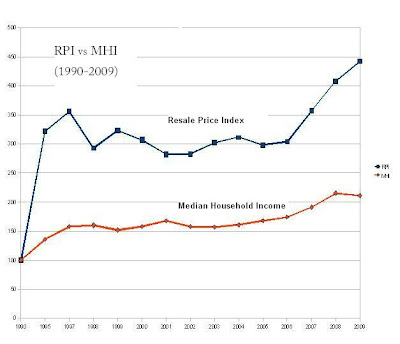 http://1.bp.blogspot.com/_XtsjYwdj2Ic/S74KTCOEX9I/AAAAAAAABGg/vphing63YyI/s1600/HDB_PRICES_20YRS.JPGThe blue line shows the Resale Price Index taken from HDB website[Link] and the red line shows the median household income(MHI) taken from wikipedia and combined with the table that appeared in Straits Times yesterday shown here:

Notice I skipped the years 1991-1994 & 1996 because wikipedia page on household income skip those years. I can update my charts if anyone can supply the data.
From the charts we can see:
1. From 1990 to 2009, RPI rose to 442 (442% of the base year) but household income rose only to 211 (211% of the base year) i.e. income rose at roughly half the rate property rose over a 20 year period. The RPI was only 34.1 in 1990, today it is 154 i.e. a HDB flat today is 4.5 times the price 20 years ago but household income is only 2.1 times.
2. You will notice the big jump from 1990 to 1995 when the RPI rose from 34.1 to 101.9. That jump occurred just after CPF was liberalised for housing in 1991. During that period household income only went up by 36% but HDB price almost tripled. CPF basically went from funding retirement to funding home purchases.
By Minister Mah's own methodology, there is no question that HDB flats were much more affordable in 1990 relative to household income than they are today. Singaporeans' inability to retire with enough funds is linked to the high cost of housing which far outstripped household income growth over the past 2 decade. The chart also tells us why life is so much tougher in Singapore today. It is not unrealistic expectations that cause this unhappiness....it is very real financial burden that caused this unhappiness and much of it is due to PAP policies.
posted by LuckySingaporean at 11:29 PM | 75 comments links to this post
</TD></TR></TBODY></TABLE>
Thursday, April 08, 2010
<!-- Begin .post -->Mah Bow Tan : We don't fudge the numbers Part 2
Here's the chart from the Straits Times to show that HDB price move in tandem with household income:

Hazel Poa[Link] showed that when the base year is changed to another year besides 1999 the household income falls behind the rise in property prices. But there is something more sinister that can be shown in these charts.
You wonder what the same chart looks like if we go back another 10 years to plot for a 20 year period with 1990 as the base year:
 http://1.bp.blogspot.com/_XtsjYwdj2Ic/S74KTCOEX9I/AAAAAAAABGg/vphing63YyI/s1600/HDB_PRICES_20YRS.JPGThe blue line shows the Resale Price Index taken from HDB website[Link] and the red line shows the median household income(MHI) taken from wikipedia and combined with the table that appeared in Straits Times yesterday shown here:
Notice I skipped the years 1991-1994 & 1996 because wikipedia page on household income skip those years. I can update my charts if anyone can supply the data.
From the charts we can see:
1. From 1990 to 2009, RPI rose to 442 (442% of the base year) but household income rose only to 211 (211% of the base year) i.e. income rose at roughly half the rate property rose over a 20 year period. The RPI was only 34.1 in 1990, today it is 154 i.e. a HDB flat today is 4.5 times the price 20 years ago but household income is only 2.1 times.
2. You will notice the big jump from 1990 to 1995 when the RPI rose from 34.1 to 101.9. That jump occurred just after CPF was liberalised for housing in 1991. During that period household income only went up by 36% but HDB price almost tripled. CPF basically went from funding retirement to funding home purchases.
By Minister Mah's own methodology, there is no question that HDB flats were much more affordable in 1990 relative to household income than they are today. Singaporeans' inability to retire with enough funds is linked to the high cost of housing which far outstripped household income growth over the past 2 decade. The chart also tells us why life is so much tougher in Singapore today. It is not unrealistic expectations that cause this unhappiness....it is very real financial burden that caused this unhappiness and much of it is due to PAP policies.
posted by LuckySingaporean at 11:29 PM | 75 comments links to this post
</TD></TR></TBODY></TABLE>