• IP addresses are NOT logged in this forum so there's no point asking. Please note that this forum is full of homophobes, racists, lunatics, schizophrenics & absolute nut jobs with a smattering of geniuses, Chinese chauvinists, Moderate Muslims and last but not least a couple of "know-it-alls" constantly sprouting their dubious wisdom. If you believe that content generated by unsavory characters might cause you offense PLEASE LEAVE NOW! Sammyboy Admin and Staff are not responsible for your hurt feelings should you choose to read any of the content here.

    The OTHER forum is HERE so please stop asking.

covid variants : delta, kappa, alpha, beta, gamma, epsilon and theta

As expected data shows that the India variant is now worse than any other variant. Cases continue to plunge and never reached the same levels as the earlier variants that spread in Europe, South America and the USA.

View attachment 112655

View attachment 112656

Wrong. Again. Call if 0 for 291 tries, all failed

India lockdown and positivity still high

E1u6n67VIAYzfS4.jpg
 

Not a shred of doubt: Sweden was right

Eyal Shahar
Eyal Shahar
6 days ago·6 min read


Counting the dead used to be the work of epidemiologists, statisticians and demographers. So was analyzing the numbers and drawing conclusions. In the past year many are counting deaths, but the numbers have no meaning without the context of a relevant time period, population and history. That is, epidemiology.

The most counted country is probably Sweden, a stubborn dissenter that refused lockdowns, mask mandates and contact tracing. By the time of this writing, 14,349 Swedes have reportedly died from the coronavirus. Has the Swedish model failed? Were the lockdowns justified? Were the economic and social upheavals in most of the world an unavoidable necessity?

The answer to all is a resounding no. The first (and not the only) witness: Sweden. To understand the testimony, we need to learn only two concepts: “flu year” and “excess mortality”.

“Flu year” versus calendar year

Many calculate mortality statistics according to the Gregorian calendar, but December 31st is not a meaningful end date for winter mortality in the northern hemisphere. The flu wave and the associated wave of mortality reach the peak at various dates, and sometimes secondary waves appear. Furthermore, the use of the Gregorian calendar combines the mortality in the first part of one winter (sometimes mild) with mortality in the second part of the previous winter (sometimes severe). There is no scientific justification for this grouping when analyzing historical trends.

The statistical alternative, which may be called “flu year”, contains a full winter season. Annual mortality is calculated from the beginning of the flu season, which is usually counted from week 40 (early October), till week 39 in the following year (end of September). Thus, the coronavirus waves in the spring and summer of 2020 belong to the 2019–2020 flu year, whereas the last winter wave belongs to the current flu year which will end in September.

Excess mortality

The concept of “excess mortality” is a little abstract. We need to compare actual mortality with “expected mortality”, but the latter is a theoretical idea that cannot be verified: what would the mortality in the 2019–2020 flu year have been, had there not been a pandemic? How do we calculate “expected mortality”?

One method uses a statistical model called linear regression. We fit a line to the mortality data from previous years, check its past performance, and use the continuation of the line to compute expected mortality. The distance between a data point of actual mortality and expected mortality on the line is excess mortality (or “mortality deficit”).

Mortality in Sweden by flu year

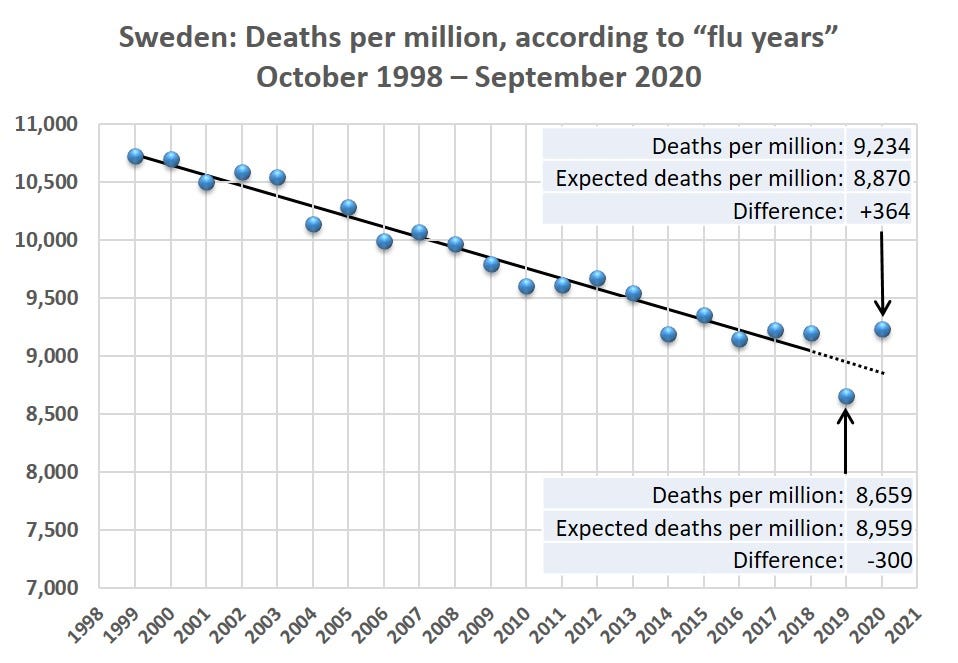
The graph shows the annual mortality in Sweden per million people in the last 22 flu years, where each flu year is labeled according to the calendar year in which it ends. For example, the last data point on the graph is mortality between October 2019 and September 2020: 9,234 per million people (95,365 deaths). To magnify, the vertical axis starts at 7,000.

1*C9en4bULrelzv0lpLIJbOQ.jpeg

Source: SCB.SE
It is easy to see that the points are located close to a straight line, until the flu year that ended in September 2018. The general downward trend reflects a consistent increase in life expectancy in Sweden for many years.

Experienced data analysts will attest that the fluctuations around the line are generally small and expected until 2018 (explained variation: 0.96). In contrast, both the flu year that preceded the pandemic (2018–2019) and the pandemic year (2019–2020) substantially deviate from the line: the former — in lower than expected mortality, and the latter — in higher than expected mortality.

Excess mortality in Sweden in flu year 2019–2020

Continuation of the line, which was fit by the statistical model, yields the following estimates: In 2018–2019 there was “mortality deficit” in Sweden of 300 per million people (-3.3%) whereas in 2019–2020, the pandemic year, there was excess mortality of 364 per million people (+4.1%). Excess mortality following mortality deficit, and vice versa, are well known and expected, as the main source of mortality is an elderly population with limited life expectancy. (The sequence “excess after deficit” is, of course, better than the reverse order.)

Assuming the excess mortality in 2019–2020 “fully balanced” the mortality deficit in the previous flu year, the true excess mortality in Sweden was less than 1% (about 700 deaths). And if we assume, absurdly, that the mortality in 2019–2020 was not affected at all by the mortality deficit in the previous flu year, then the excess mortality in Sweden did not exceed 4.1% (about 3,800 deaths). Excess mortality of a few percentage points, or more, has been calculated in many countries where life has been severely disrupted. Part of that excess has been attributed to lockdown and panic.

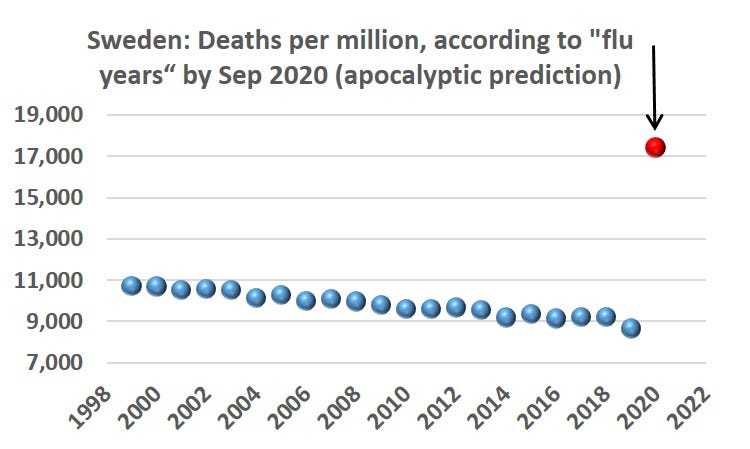
To remind us, the hysterical response to the pandemic was not due to fear of an excess annual mortality of 4% or even 10%. The apocalyptic forecasts, which caused the world to shut down, predicted about 90,000 deaths from the coronavirus in Sweden by the summer of 2020: 100% excess mortality! No wonder policy makers around the world prefer to forget those predictions.

1*IPgJOW1cQ-GoOsrnqwQ4yg.jpeg

1*IPgJOW1cQ-GoOsrnqwQ4yg.jpeg

Mortality in Sweden in the current flu year

The final summary of the current flu year (October 2020 — September 2021) will be known in the fall, but the data accumulated more than halfway through allow for interim conclusions. As many know, the coronavirus replaced the flu viruses this year, and there was no flu in Sweden, either. Nor were there apocalyptic predictions; only warnings about the number of accumulated deaths.

I chose to compare the mortality in Sweden in the current flu year (week 40, 2020 till week 15, 2021) to the corresponding mortality in 2017–2018. Two reasons for this choice: First, Europe experienced a severe flu season in that winter, which makes it an appropriate comparison. Second, although the flu season was severe in Sweden compared to previous years, it was still substantially milder than in Europe as a whole.

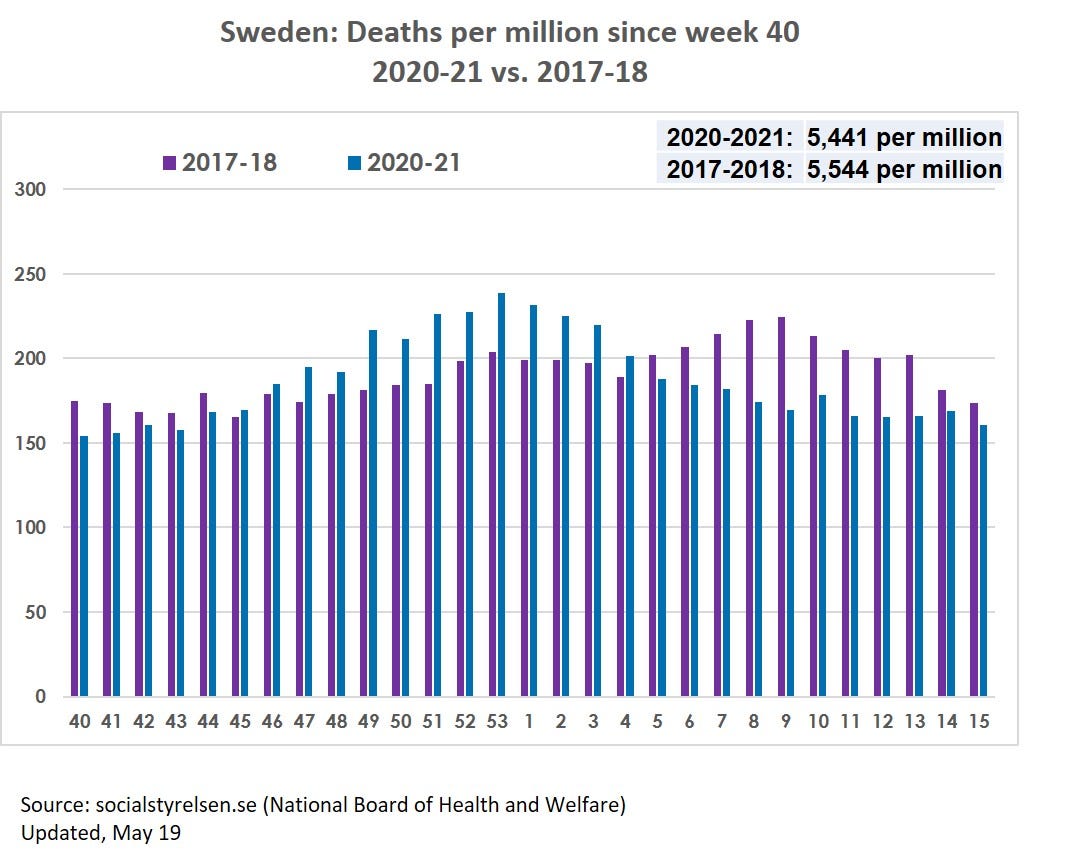
The graph shows a low mortality wave at the end of 2017 and a noticeable wave in February-March 2018 (another example of why a December 31st cutoff might distort historical trends). This winter, the mortality wave coincided with the coronavirus wave and its peak in late December. (In 2020 there were 53 weeks, so the dates do not exactly match.) A secondary coronavirus wave, which appeared in mid-February, half way through the decline of the former, did not result in a secondary mortality wave.

1*yVzc0DkTufslYR89rTpU7A.jpeg

1*yVzc0DkTufslYR89rTpU7A.jpeg

The all-cause death toll in Sweden in the first 29 weeks of the current flu year is 56,452 (5,441 per million people) compared to 55,967 (5,544 per million people) in the same period in 2017–2018. In that winter, the excess mortality rate in Europe attributed to the flu was at least twice as high as in Sweden.

Sweden proved right in the retest.

A colossal mistake

The pandemic has taken its death toll, ranging from large to small in different countries and within countries, and mostly affected the frail elderly. But the lockdowns and panic were unsubstantiated, prevented nothing, and caused indescribable damage to society. Sweden’s statistics tell us, unequivocally, that in much of the world lives have been lost and livelihoods have been destroyed — in vain.

Will anyone, in any country, be held accountable?

Wrong. Again. Call it 0 for 296 tries, all failed

https://www.theguardian.com/commentisfree/2021/jan/03/swedish-model-failed-covid-19

Now the Swedish model has failed, it's time to ask who was pushing it​

Peter Geoghegan

A light-touch approach to Covid-19 doesn’t work. But that didn’t stop pundits and thinktanks from advocating it for the UK
The Chancellor Rishi Sunak visits a Wagamama restaurant

‘The image of a maskless Rishi Sunak serving meals in a London Wagamama to launch August’s ‘eat out to help out’ initiative has not aged well.’ Photograph: Simon Walker/HM Treasury
Sun 3 Jan 2021 08.00 EST


831

When future historians come to write the story of Britain’s chaotic pandemic response, one question in particular will surely puzzle them: why, as the UK experienced one of the world’s worst Covid outbreaks, did so many prominent public figures spend so much of 2020 talking about Sweden?
Almost as soon as Boris Johnson announced a national lockdown in late March, British newspaper columnists and professional contrarians demanded that the prime minister adopt “the Swedish model” – and they were still urging the same in September. We now know with certainty what public health experts have long predicted: a light-touch coronavirus approach does not work. Sweden has recorded far higher death rates than its Nordic neighbours, while suffering a similar economic hit. Even the country’s king thinks it has “failed”.
Advertisement
America is finally acknowledging the Tulsa racemassacre. The next step is reparations | Akin Olla

And yet, through the late autumn, as the Covid virus was mutating in England, Sweden was still being cited as an example to follow. In mid-October, the Tory MP Christopher Chope was in parliament extolling the virtues of what he previously called Sweden’s “clear and simple” approach. Just last month, the Telegraph columnist Allison Pearson tweeted that she “admired Sweden’s handling of the pandemic”.
Of course, the full-throated cries of “Sweden” from sections of the conservative press were less about the birthplace of Abba, and more about fostering the idea that Britain could just “open up”, if only politicians were brave enough to do so. Self-styled lockdown sceptics promised – and still promise – that “herd immunity” would save us all, and routinely pointed to Sweden’s adoption of this approach as proof.
Our future historians will doubtless wonder, too, just how, in the imagination of many on the British right, Sweden went from gang violence-riddled dystopia to exemplar in a few months. The answer is quite simple: the same small group of people who talked so fervently about Sweden’s libertarian refusal to lock down – newspaper columnists, backbench MPs, anonymously funded thinktanks – have massively outsized access to British public debate.
All of this is very familiar. In my latest book, I chart how a cadre of backbench Tory MPs, anonymously funded thinktanks and ubiquitous media commentators turned “no-deal Brexit” from an outlandish notion to “nothing to fear”. During the pandemic, the same strategies were employed – often by the same people.
Having held up Norway as a model during the Brexit referendum, Daniel (soon to be lord) Hannan said we could all be like Sweden. Christopher Snowdon of the Institute of Economic Affairs declared that Sweden had demonstrated “a more sensible way to balance risk, liberty and the economy”. After so successfully mobilising the European Research Group of Tory MPs to push for a hard Brexit, Steve Baker even started up a tribute act: the Covid Recovery Group, or CRG for short.
All this talk of Sweden appears to have influenced the decision-making in Downing Street. A recent report in the Sunday Times suggested Johnson chose not to impose a circuit-breaker lockdown in September after a meeting with chancellor Rishi Sunak and three proponents of a herd immunity strategy: Sunetra Gupta and Carl Heneghan of the University of Oxford and Anders Tegnell, the epidemiologist behind Sweden’s laissez-faire approach to the pandemic. (When openDemocracy asked for details of Tegnell’s correspondence with the prime minister’s office, it was told that any release could compromise the formulation of government policy.)
The ubiquity of contrarian voices on Covid played into Boris Johnson’s well-documented tendency for indecision. As anyone looking to influence the prime minister knows, when faced with an array of choices, he will often do nothing. The delay in imposing restrictions in England after September’s meeting with Tegnell and co led to an estimated 1.3m extra Covid infections.
The rhetoric around the Swedish model – and herd immunity – set the stage for Britain to loosen restrictions faster than scientists, or even the public, wanted. We were even offered a financial incentive to do the one thing we have always known spreads the virus: mix indoors. The image of a maskless Rishi Sunak serving meals in a London Wagamama to launch August’s “eat out to help out” initiative has not aged well. (Research suggests that the scheme directly contributed to a rise in infections.)
Sunak is part of the growing libertarian trend among Conservative MPs, many of whom have been vociferous in their opposition to renewed lockdown measures. Lockdown sceptics have had financial support, too: the much-discussed Great Barrington declaration, which advocated herd immunity, was coordinated by a US thinktank that has received funding from the billionaire Koch brothers, who pumped huge sums into the Republican party and its fringes.
All of this has shaped Britain’s haphazard pandemic response. Faced with pressure from lockdown sceptics in the media and inside his own party, Johnson dithered, time and again. When the prime minister’s chief scientists were urging greater restrictions in December, the prime minister’s transport secretary Grant Shapps was announcing a £3m scheme to bus people to visit their family at Christmas. Less than a week later, most of England went into tier 4. Meanwhile, lockdown sceptics are still cherrypicking data to suggest that Covid is overhyped, even as hospital cases surge to new highs.
The British government is now facing 2021 with a Covid infection rate that the health secretary admits is out of control, but with many of its own MPs firmly opposed to further restrictions. Maybe we shouldn’t wait for the historians’ verdict before we ask ourselves whether it is a good idea to allow a handful of pundits, thinktanks and backbenchers to exert such a pull on British public life.
 

Open Schools, Covid-19, and Child and Teacher Morbidity in Sweden​


To the Editor:​


In mid-March 2020, many countries decided to close schools in an attempt to limit the spread of severe acute respiratory syndrome coronavirus 2 (SARS-CoV-2), the virus causing coronavirus disease 2019 (Covid-19).1,2 Sweden was one of the few countries that decided to keep preschools (generally caring for children 1 to 6 years of age) and schools (with children 7 to 16 years of age) open. Here, we present data from Sweden on Covid-19 among children 1 to 16 years of age and their teachers. In Sweden, Covid-19 was prevalent in the community during the spring of 2020.3 Social distancing was encouraged in Sweden, but wearing face masks was not.3

Data on severe Covid-19, as defined by intensive care unit (ICU) admission, were prospectively recorded in the nationwide Swedish intensive care registry. We followed all children who were admitted to an ICU between March 1 and June 30, 2020 (school ended around June 10) with laboratory-verified or clinically verified Covid-19, including patients who were admitted for multisystem inflammatory syndrome in children (MIS-C, which is likely to be related to Covid-19)4 according to the Swedish Pediatric Rheumatology Quality Register. (More information on the registry and a link to the World Health Organization scientific brief on MIS-C are provided in the Supplementary Appendix, available with the full text of this letter at NEJM.org.) The Stockholm Ethics Review Board approved the study. Informed consent was waived by the review board.

Table 1. Characteristics of the Children with Covid-19, Including Those with MIS-C, Admitted to Swedish ICUs in March–June 2020.
The number of deaths from any cause among the 1,951,905 children in Sweden (as of December 31, 2019) who were 1 to 16 years of age was 65 during the pre–Covid-19 period of November 2019 through February 2020 and 69 during 4 months of exposure to Covid-19 (March through June 2020) (see the Supplementary Appendix). From March through June 2020, a total of 15 children with Covid-19 (including those with MIS-C) were admitted to an ICU (0.77 per 100,000 children in this age group) (Table 1), 4 of whom were 1 to 6 years of age (0.54 per 100,000) and 11 of whom were 7 to 16 years of age (0.90 per 100,000). Four of the children had an underlying chronic coexisting condition (cancer in 2, chronic kidney disease in 1, and hematologic disease in 1). No child with Covid-19 died.

Data from the Public Health Agency of Sweden (published report5 and personal communication) showed that fewer than 10 preschool teachers and 20 schoolteachers in Sweden received intensive care for Covid-19 up until June 30, 2020 (20 per 103,596 schoolteachers, which is equal to 19 per 100,000). As compared with other occupations (excluding health care workers), this corresponded to sex- and age-adjusted relative risks of 1.10 (95% confidence interval [CI], 0.49 to 2.49) among preschool teachers and 0.43 (95% CI, 0.28 to 0.68) among schoolteachers (see the Supplementary Appendix).

The present study had some limitations. We lacked data on household transmission of Covid-19 from schoolchildren, and the 95% confidence intervals for our results are wide.

Despite Sweden’s having kept schools and preschools open, we found a low incidence of severe Covid-19 among schoolchildren and children of preschool age during the SARS-CoV-2 pandemic. Among the 1.95 million children who were 1 to 16 years of age, 15 children had Covid-19, MIS-C, or both conditions and were admitted to an ICU, which is equal to 1 child in 130,000.

Jonas F. Ludvigsson, M.D., Ph.D.
Karolinska Institutet, Stockholm, Sweden
[email protected]
 
Age​
Sex​
SARS-CoV-2 Test Result​
Days in ICU
No. of Admissions​
BP and Laboratory Measures at Admission
Organ Support​
Complications​
PCR​
Antibodies​
1 yr§
F​
Negative​
Positive​
5​
1​
Systolic BP, 70 mm Hg; SaO2, 99%; BE, +0.6 mmol/liter; lactate, 1.6 mmol/liter​
—​
MIS-C, septic shock, renal failure​
3 yr​
F​
Positive​
ND​
38​
3​
Systolic BP, 75 to 143 mm Hg; SaO2, 96%; lactate, 1.2 mmol/liter​
Invasive mechanical ventilation​
Clostridium difficile infection​
4 yr​
F​
Positive​
Positive​
6​
1​
Systolic BP, 87 mm Hg; SaO2, 99%​
—​
MIS-C, renal failure, coagulation disorder​
5 yr​
F​
Positive​
Positive​
3​
1​
Systolic BP, 83 mm Hg; SaO2, 98%; BE, −0.7 mmol/liter​
—​
MIS-C​
7 yr
M​
Negative​
ND​
<1​
1​
Systolic BP, 85 mm Hg, SaO2, 97%; BE, −0.7 mmol/liter​
—​
Iron deficiency, coma, fever​
7 yr​
F​
Positive​
Positive​
35​
2​
Systolic BP, 115 mm Hg; SaO2, 90%; lactate, 0.8; BE, +5 mmol/liter​
Invasive mechanical ventilation, renal replacement therapy​
—​
10 yr§
F​
Negative​
Positive​
1​
1​
Systolic BP, 95 mm Hg; SaO2, 99%; lactate, 1.1 mmol/liter; BE, −1.5 mmol/liter​
—​
MIS-C, cardiomyopathy​
12 yr​
M​
Positive​
ND​
<1​
1​
Systolic BP, 100 mm Hg; SaO2, 98%; BE, −6 mmol/liter​
—​
—​
12 yr​
M​
Positive​
ND​
2​
1​
—​
—​
Viral pneumonia​
13 yr​
M​
Positive​
ND​
11​
2​
Systolic BP, 123 to 137 mm Hg; SaO2, 92%; lactate, 0.9 mmol/liter; BE, +3.2 mmol/liter​
—​
—​
13 yr​
F​
Positive​
Positive​
7​
2​
Systolic BP, 80 mm Hg; SaO2, 98%; lactate, 3.7 mmol/liter; BE, −9 mmol/liter​
Invasive mechanical ventilation​
MIS-C, heart failure​
14 yr§
M​
Negative​
Positive​
4​
1​
Systolic BP, 57 mm Hg; SaO2, 98%; lactate, 3.4 mmol/liter; BE, −1.5 mmol/liter​
—​
MIS-C, myocarditis, sepsis​
14 yr​
M​
Positive​
ND​
4​
2​
Systolic BP, 90 to 100 mm Hg; SaO2, 83%; lactate, 2.7 mmol/liter; BE, +4 mmol/liter​
Invasive mechanical ventilation​
—​
16 yr​
M​
Positive​
Positive​
9​
1​
—​
—​
—​
16 yr
M​
Negative​
Positive​
5​
1​
—​
—​
MIS-C, myocarditis with heart failure​
* Four children had underlying conditions: 2 had cancer, 1 had chronic kidney disease, and 1 had hematologic disease and had undergone stem-cell transplantation. Two children had additional conditions: 1 had alcohol intoxication, and 1 had sustained a traumatic injury; coronavirus disease 2019 (Covid-19) was diagnosed in these 2 children only when they underwent screening for severe acute respiratory syndrome coronavirus 2 (SARS-CoV-2) in the intensive care unit (ICU) (they did not have Covid-19 symptoms). BE denotes base excess, BP blood pressure, MIS-C multisystem inflammatory syndrome in children, ND not done, PCR polymerase chain reaction, and SaO2 oxygen saturation.
† For patients with multiple admissions, the total duration is reported.
‡ For patients with multiple admissions, the most aberrant value is reported.
§ The patient was identified through the presence of MIS-C according to the Swedish Pediatric Rheumatology Quality Register. Covid-19 was not diagnosed during ICU care, but the results of subsequent antibody testing were positive.
 
PCR​
Antibodies​
Age​
Sex​
SARS-CoV-2 Test Result​
Days in ICU
No. of Admissions​
BP and Laboratory Measures at Admission
Organ Support​
Complications​
1 yr§
F​
Negative​
Positive​
5​
1​
Systolic BP, 70 mm Hg; SaO2, 99%; BE, +0.6 mmol/liter; lactate, 1.6 mmol/liter​
—​
MIS-C, septic shock, renal failure​
3 yr​
F​
Positive​
ND​
38​
3​
Systolic BP, 75 to 143 mm Hg; SaO2, 96%; lactate, 1.2 mmol/liter​
Invasive mechanical ventilation​
Clostridium difficile infection​
4 yr​
F​
Positive​
Positive​
6​
1​
Systolic BP, 87 mm Hg; SaO2, 99%​
—​
MIS-C, renal failure, coagulation disorder​
5 yr​
F​
Positive​
Positive​
3​
1​
Systolic BP, 83 mm Hg; SaO2, 98%; BE, −0.7 mmol/liter​
—​
MIS-C​
7 yr
M​
Negative​
ND​
<1​
1​
Systolic BP, 85 mm Hg, SaO2, 97%; BE, −0.7 mmol/liter​
—​
Iron deficiency, coma, fever​
7 yr​
F​
Positive​
Positive​
35​
2​
Systolic BP, 115 mm Hg; SaO2, 90%; lactate, 0.8; BE, +5 mmol/liter​
Invasive mechanical ventilation, renal replacement therapy​
—​
10 yr§
F​
Negative​
Positive​
1​
1​
Systolic BP, 95 mm Hg; SaO2, 99%; lactate, 1.1 mmol/liter; BE, −1.5 mmol/liter​
—​
MIS-C, cardiomyopathy​
12 yr​
M​
Positive​
ND​
<1​
1​
Systolic BP, 100 mm Hg; SaO2, 98%; BE, −6 mmol/liter​
—​
—​
12 yr​
M​
Positive​
ND​
2​
1​
—​
—​
Viral pneumonia​
13 yr​
M​
Positive​
ND​
11​
2​
Systolic BP, 123 to 137 mm Hg; SaO2, 92%; lactate, 0.9 mmol/liter; BE, +3.2 mmol/liter​
—​
—​
13 yr​
F​
Positive​
Positive​
7​
2​
Systolic BP, 80 mm Hg; SaO2, 98%; lactate, 3.7 mmol/liter; BE, −9 mmol/liter​
Invasive mechanical ventilation​
MIS-C, heart failure​
14 yr§
M​
Negative​
Positive​
4​
1​
Systolic BP, 57 mm Hg; SaO2, 98%; lactate, 3.4 mmol/liter; BE, −1.5 mmol/liter​
—​
MIS-C, myocarditis, sepsis​
14 yr​
M​
Positive​
ND​
4​
2​
Systolic BP, 90 to 100 mm Hg; SaO2, 83%; lactate, 2.7 mmol/liter; BE, +4 mmol/liter​
Invasive mechanical ventilation​
—​
16 yr​
M​
Positive​
Positive​
9​
1​
—​
—​
—​
16 yr
M​
Negative​
Positive​
5​
1​
—​
—​
MIS-C, myocarditis with heart failure​
* Four children had underlying conditions: 2 had cancer, 1 had chronic kidney disease, and 1 had hematologic disease and had undergone stem-cell transplantation. Two children had additional conditions: 1 had alcohol intoxication, and 1 had sustained a traumatic injury; coronavirus disease 2019 (Covid-19) was diagnosed in these 2 children only when they underwent screening for severe acute respiratory syndrome coronavirus 2 (SARS-CoV-2) in the intensive care unit (ICU) (they did not have Covid-19 symptoms). BE denotes base excess, BP blood pressure, MIS-C multisystem inflammatory syndrome in children, ND not done, PCR polymerase chain reaction, and SaO2 oxygen saturation.
† For patients with multiple admissions, the total duration is reported.
‡ For patients with multiple admissions, the most aberrant value is reported.
§ The patient was identified through the presence of MIS-C according to the Swedish Pediatric Rheumatology Quality Register. Covid-19 was not diagnosed during ICU care, but the results of subsequent antibody testing were positive.

shut the fuck up asshole
 
Back
Top