• IP addresses are NOT logged in this forum so there's no point asking. Please note that this forum is full of homophobes, racists, lunatics, schizophrenics & absolute nut jobs with a smattering of geniuses, Chinese chauvinists, Moderate Muslims and last but not least a couple of "know-it-alls" constantly sprouting their dubious wisdom. If you believe that content generated by unsavory characters might cause you offense PLEASE LEAVE NOW! Sammyboy Admin and Staff are not responsible for your hurt feelings should you choose to read any of the content here.

    The OTHER forum is HERE so please stop asking.

Will Nvidia stock crash?

1737891678720.png
 
The Nvidia stock has been tanking nev make new high. Once they crashed, micron also will crash. Retrenchment coming....
 
i had been researching on DeepSeek and playing with the DeepSeek app. This is a real deal and if its true they only use 5pc of what OpenAI use in Compute.. The Magnificent Stocks will crash… :sick:
crash not crash is another thing it does not follow the normal 出牌游戏
 

A Major Market Correction Is Coming​

Jan. 23, 2025 3:40 PM ETS&P 500 Index (SPX), NDX, SP500, DJI181 Comments

Michael James McDonald
6.27K Followers
Play(9min)

Summary​

  • Be careful with economic forecasts; the stock market is a leading indicator, driven more by investor emotions than economic data.
  • Current levels of extreme bullish sentiment, plus very distinct Elliott Wave patterns, suggest we are in the middle of a longer-term corrective pattern.
  • Historical parallels, like the 1968-74 stock market, show a similar corrective pattern, which reinforces our expectation of a significant market downturn.
  • Our recommended asset allocation remains consistent with our expectations of a major correction, probably ending sometime in early 2026.


Business on Wall Street in Manhattan


Pgiam/iStock via Getty Images


As strange as it may sound, to be successful you must set aside stock market forecasts based on the economy. Why? Because the stock market is a leading economic indicator, which means using the economy to forecast the stock market is like driving a car looking in the rearview mirror.

Warren Buffett knew this when he said, “A simple rule dictates my buying: Be fearful when others are greedy and be greedy when others are fearful.” Notice he doesn’t buy because of “interest rates”, “earnings” or “the economy”, just emotions.

And right now, the level of investor greed and optimism suggests we're headed for a major correction. But what kind of correction? It’s here where the combination of investor sentiment and the Elliott Wave theory guide us.

We think we are at a unique moment. Let me explain.

Too Much Greed

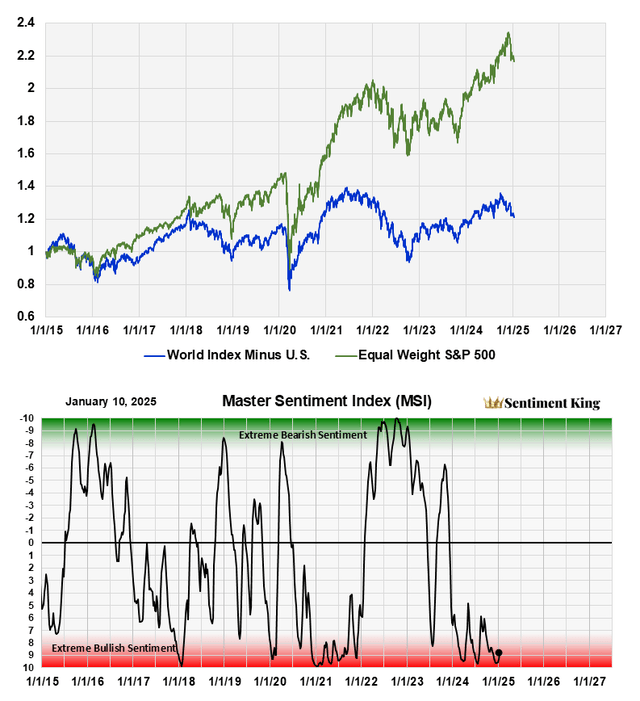
At the Sentiment King, we use our Master Sentiment Indicator to measure investor greed and fear. It's made from nine different sentiment indicators and is shown in the chart below.

Red Zone readings represent extreme bullish sentiment and excessive greed. Green Zone readings represent extreme fear and bearish sentiment. We registered Red Zone readings three times in 2024.

From a historic perspective, we currently have a level of investor greed and optimism that has preceded major corrections and bear markets in the past. But again, what kind of correction?


A graph of stock market Description automatically generated with medium confidence
The Master Sentiment Indicator Plotted Against Two Major Indices - The Equal Weight S&P 500 and The World Stock Index Minus the U.S. Each Index Is Reset To 1 in 2015. (The Sentiment King)


The indicator is plotted against two market indexes – the equal weighted S&P 500 and the world stock market index minus the U.S. These indexes show two things.

The first is the under performance of the world stock markets compared to the United States.

The second is a similarity in price patterns. While both indexes show the bear markets of 2022, the S&P goes on to make new highs while the World Index doesn't. The World Index has essentially double topped, with the high made in 2021.

But there is more to this similarity from my perspective; I see something very unique.

I see a bear market followed by a two-year rally as parts of a longer-term corrective pattern which is not finished. In fact, the current market is almost identical to the market from 1968 to 1974.
 

Elliot Wave Corrections

According to Elliott Wave, once an advance ends, a price correction ensues and a price correction always occurs in two declining waves or sections separated by a rally.

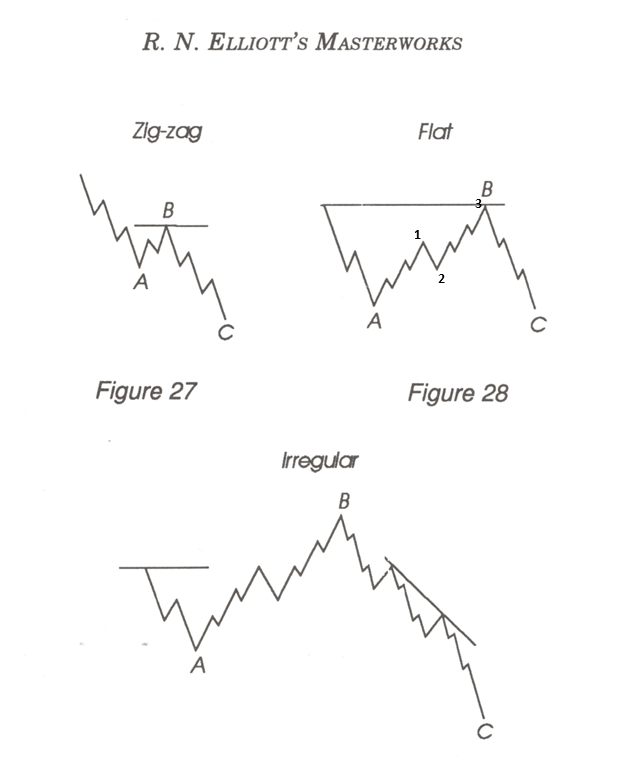
The first declining wave is called A, the rally in-between is called B, and the second declining wave is called C. This ABC corrective pattern, which is taken from R.N. Elliott’s original works, is shown below. Corrections form the most interesting part of the Elliott Wave theory.


A graph of different angles Description automatically generated with medium confidence

Elliot Wave Corrections Taken From R.N. Elliott's Masterworks (The Sentiment King)


There are variations in the basic pattern ABC pattern. The most common is called a FLAT, which is the pattern in the upper right.

With a FLAT, once the first declining wave ends at A, the rally that ensues carries prices back up to the previous high, and you get an effective double top at B. Then the second selling wave called C carries prices back down to the low of wave A.

With an IRREGULAR correction, the B rally carries prices to highs that exceed the highs of the main advance. This makes people assume the B wave is part of the earlier advance, and yet, it is actually part of the correction process. This is shown in the bottom pattern.

The critical thing with B waves is they have a clearly defined 123 structure. As a matter of fact, the distinguishing characteristics of a B wave is that it takes place in two upward sections or rallies, not the normal 3 of the primary trend. You see this 123 pattern in the FLAT diagram.

The stock market between 1968 and 1974 displayed just this type of corrective pattern.

Let's take a look at the 1968–1974 stock market period.

The 1968 – 1974 Stock Market

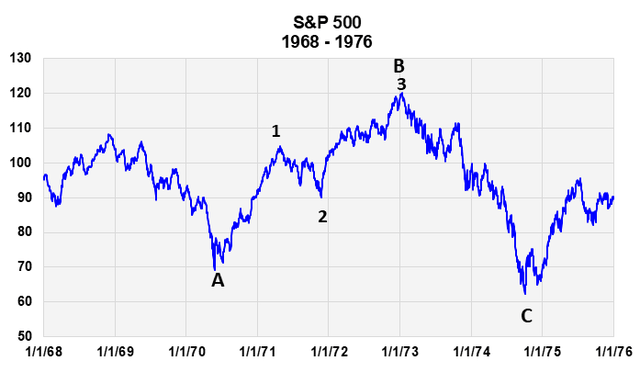
While most investors considered the two bear markets during this period as separated events, insightful technicians could see they were really the two selling waves of a massive six-year correction of the previous 20-year secular bull market. We've marked them ABC.


A graph showing the stock market Description automatically generated
The 1968 to 1976 Stock Market (The Sentiment King)


Once the huge, 20 year secular bull market of the 1950s and 60s ended, a large correction followed. It’s graphed above. It went from 1968 to 1974 and lasted six years.

The first selling wave of the correction was the 1969-70 bear market. It lasted one year and ended at point A.

Then a 2 1/2 year rally followed. Many consider this a bull market, but the advance took place in two waves marked (1) and (3), so it had the basic characteristic of a B wave.

The peak of this rally (B) went slightly above the 1968 high, so technically it was an irregular correction, but I, personally, consider it more a FLAT because it double topped in a number of other indices. But these are basically the same thing; just stretched versions of one another.

The final selling wave of the correction was the two year, 1973-74 bear market, where prices declined 50%. It ended at C.

We believe we have a similar situation today.
 

Today’s Market

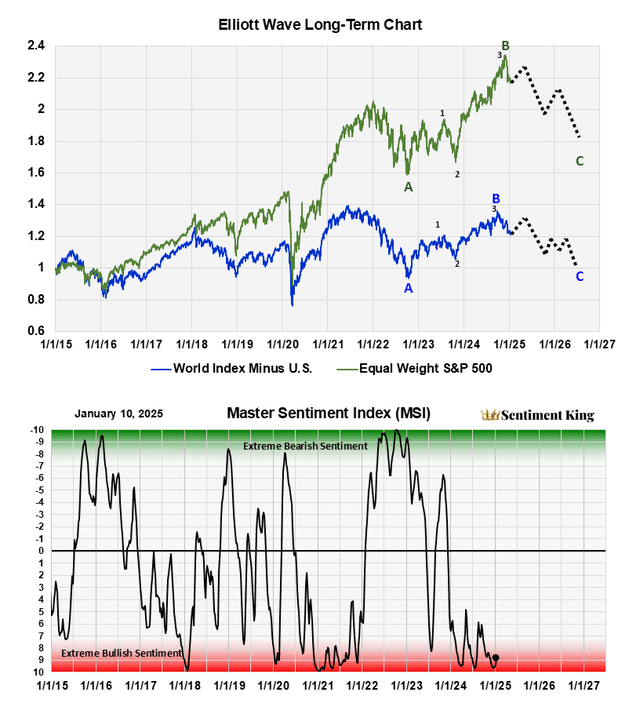
Now it’s time to look again at those two indices we plotted against our Master Sentiment Indicator in the first graph. They’re shown again below, but this time we’ve added some numbers and letters.

It shows the rally over the last two years is really part of a larger correction, much like the 1971-72 rally was in the 1968-74 market.

It also shows the World Market index forming a very standard ABC flat, with our projection (dotted lines) of a C wave that bottoms sometime in early 2026.


A screenshot of a graph Description automatically generated
The Master Sentiment Indicator Plotted Against Two Major Indices - The Equal Weight S&P 500 and The World Stock Index Minus the U.S. Each Index Is Reset To 1 in 2015. Includes Our Elliott Wave Interpretation Of The Wave Pattern. (The Sentiment King)


We have the equal weighted S&P 500 forming an IRREGULAR correction, with the point B exceeding the high made in 2021.

(Don't think that because the world stock markets are not participating like the SP500 that this pattern comparison has no meaning. It does. The Elliott wave theory requires that you to consider all the various indices when looking for reliable patterns; patterns that might not be clear in another index. In this case, the ABC flat pattern of the World Index is much clearer than the irregular price pattern of the S&P 500.

By itself, the Elliott Theory is too vague to be consistently useful. It requires the integration of other concepts, like investor sentiment, to turn it into a consistently useful theory).

Conclusion

We believe the bull market of the last two years is the rally section of a longer-term correction to a stock market that's been advancing now for more than a decade. We believe it's similar to the 1971-72 rally that separated two bear markets.

This view is reinforced by the current extreme levels of bullish sentiment one normally gets prior to a major correction.

A Wonderful Test​

This moment is another wonderful test of the operating theories we've been following for many years. It's the same theory that caused us to publish our first book in the year 2000, forecasting a major ABC correction after the 'dot-com' bubble. While that forecast proved spot-on, only time will tell if this new view is also correct.

We hope we are wrong about this outlook, since we very much prefer to be bullish. We'll circle back in 2026 to review the situation.
 
nvidia is already developing and testing their next gen chips, not 1 but 6.9 years ahead.
 
Back
Top